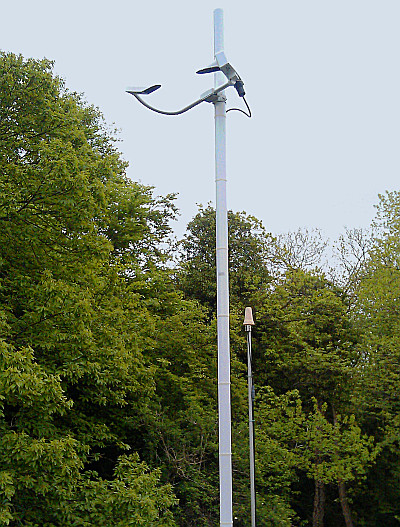
Visiometer recording visibility at the SGF
The atmospheric horizontal visibility at the SGF is measured in units of kilometres.
Installed in early 2013, the Vaisala Visibility Sensor PWD50 uses a forward scatter measurement principle to measure horizontal visibility at the facility.
The instrument emits a beam of light close to an off-axis detector which detects only scattered light. Poor visibility means more scattering and, therefore, more light received by the sensors. Fog would be an example of extremely poor visibility resulting in a large detected signal.
The graph below is interactive, draw a box with your mouse to zoom.
If you are unable to see the plot, please refresh your browser and make sure javascript is enabled. Older browsers may be unable to display the data.
The data is available for download in ascii below
The instrument emits a beam of light close to an off-axis detector which detects only scattered light. Poor visibility means more scattering and, therefore, more light received by the sensors. Fog would be an example of extremely poor visibility resulting in a large detected signal.
The plot shows the horizontal visibility (km) against time (UT) for the past 7 days, with an instrumental maximum detectable visibility of 35 kilometres.
The plot demonstrates just how rapidly and dramatically the visibility in an area can change in a short space of time.
Download the full visibility dataset beginning in 2013: * Please acknowledge the SGF if you use this data.
Download the full visibility dataset beginning in 2013: * Please acknowledge the SGF if you use this data.
With thanks to Conor Barden, Causeway School, Eastbourne.


