
|

|

|

|

|
|
Results for the Herstmonceux C-Spad detector Authors Dr. Roger Wood, Dr. Graham Appleby and Philip Gibbs |

|

|

|

|

|
|
Results for the Herstmonceux C-Spad detector Authors Dr. Roger Wood, Dr. Graham Appleby and Philip Gibbs |
Possible error sources when using C_SPAD
We have used Single-Photon Avalanche Diode (SPAD) detectors at the Herstmonceux SLR station since 1992. Their principal advantages over the traditional photo-multiplier tubes (PMTs) are the fast rise time of the avalanche to give good epoch timing, compactness, stability and robustness.
The improvements of the C-SPAD over the previous SPAD are as follows
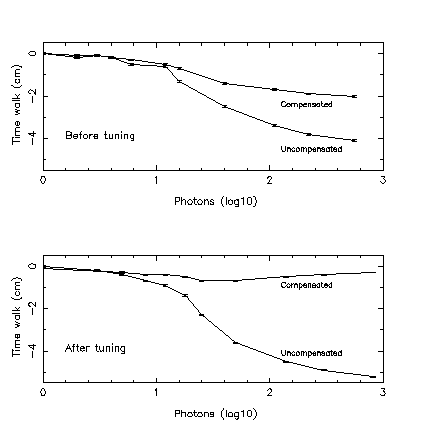
An extensive series of tests were carried out to investigate how the range to a local calibration target varied with the energy of the returning pulse. The return energy was estimated by monitoring the rate of true returns detected by the C-SPAD. (Return Energy)
|
Figure 1a Time walk for compensated and uncompensated channels of the C-SPAD before tuning
|
|
Figure 1b Time walk after the C-SPAD was tuned for correct laser pulse length.
|
The results from these initial tests are shown above. Time-walk (cm) is plotted against estimated photons. The shape of the uncompensated channel follows theoretical expectation. Theoretical model It was quickly realised that the compensated channel had been set up using a short pulse. The electronics were retuned to match our longer pulse length and the behaviour for the compensated channel was then as expected.
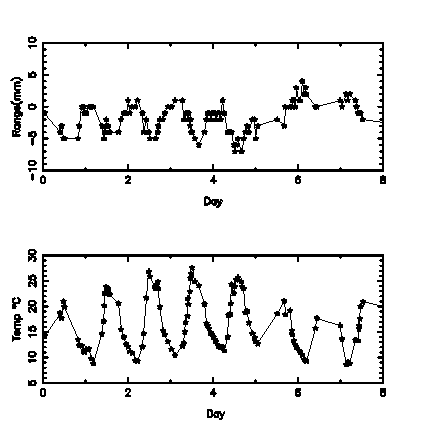
We already knew from our experience with previous SPADs that the calibration range showed clear correlation with temperature. Figure 2 shows an 8-day time series of calibration range against temperature for the uncompensated channel and a clear correlation can again be seen.
|
Figure 2a Daily variation in the calibration range in mm.
|
|
Figure 2b Daily variation in the outside temperature
|
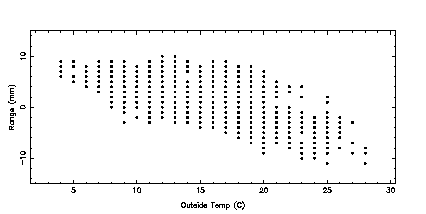
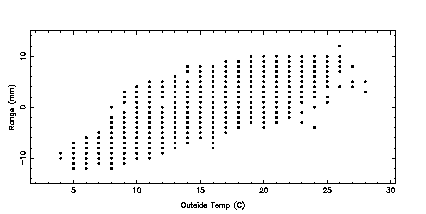
The range variations for both channels on the C-SPAD were plotted against temperature as shown in figures 3a and 3b. As can be seen from the plots the slope for the two channels have the opposite sign. This tells us that the slope is not due to expansion of the telescope or target, but is in fact a function of the detector. As the slopes are relatively small the effects can be easily eliminated by frequent calibration,especially when temperatures are changing fast.
|
Figure 3a Range variation plotted against outside temperature for uncompensated channel
|
|
Figure 3b Range variation plotted against outside temperature for compensated channel
|
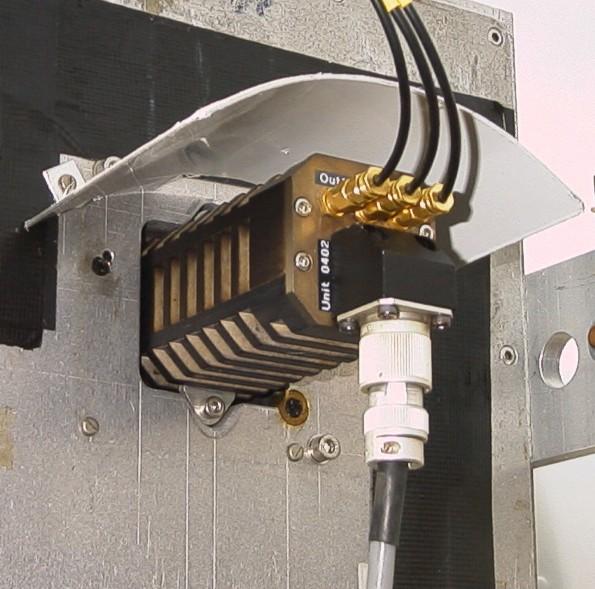 CSPAD at Cassegrain focus of Herstmonceux system
For each firing of the laser only a single event can be recorded by the
C-SPAD. This can be a true return, detector noise or daylight. We must
distinguish between these different returns when calculating the true data
return rate.
We compute the return rate from ranging sessions by counting the number of
laser shots in a given time interval, normally 10 seconds. For each of these
shots we check whether a noise event is detected before the true event could
occur, which reduces by one the effective number of laser shots. From the number
of true returns from the target we can compute the true return rate as a
percentage of the number of effective laser shots.
Under normal working conditions the software works out the percentage return
rate and maintains the system at single photon level by the use of neutral
density filters.
For a detector with quantun efficiency qe, we can relate the return rate
to the number n of photons reaching the detector from
For the C-SPAD we have qe=0.2. For standard calibration ranging this
rate is maintained at about 10-15% by attenuating the outgoing beam, and by
selecting the appropriate ND filter and iris so that n<=1.
We have determined the relationship between all of the NDs and irises based
on return rates up to 100% return rate. These relationships enable us to
estimate the return energy when the return rate is greater than 100%.
We have estimates based on our own experiments and the manufacture details
for each component of our system. (C-SPAD,Laser,Start-diode,SR620 timer)
Quadratic combination of these values gives us an expected single-shot
single-photon rms range precision very close to the experimental mean.
Using these parameters, we have set up a model of the expected change of
calibration value as a function of number of returning photons as described
in detail in
Satellite Signatures in SLR Observations, NASA Conf. Proc 3214
Eighth International Workshop on Laser Ranging Instrumentation
G.M.Appleby
Back to time walk results